
Products
| Chemical Imaging Moran Scientific offers professional, complete analysis system for quantitative mapping and chemical phase X-ray mapping. |
| Screenshots |
|
|
|
|
|
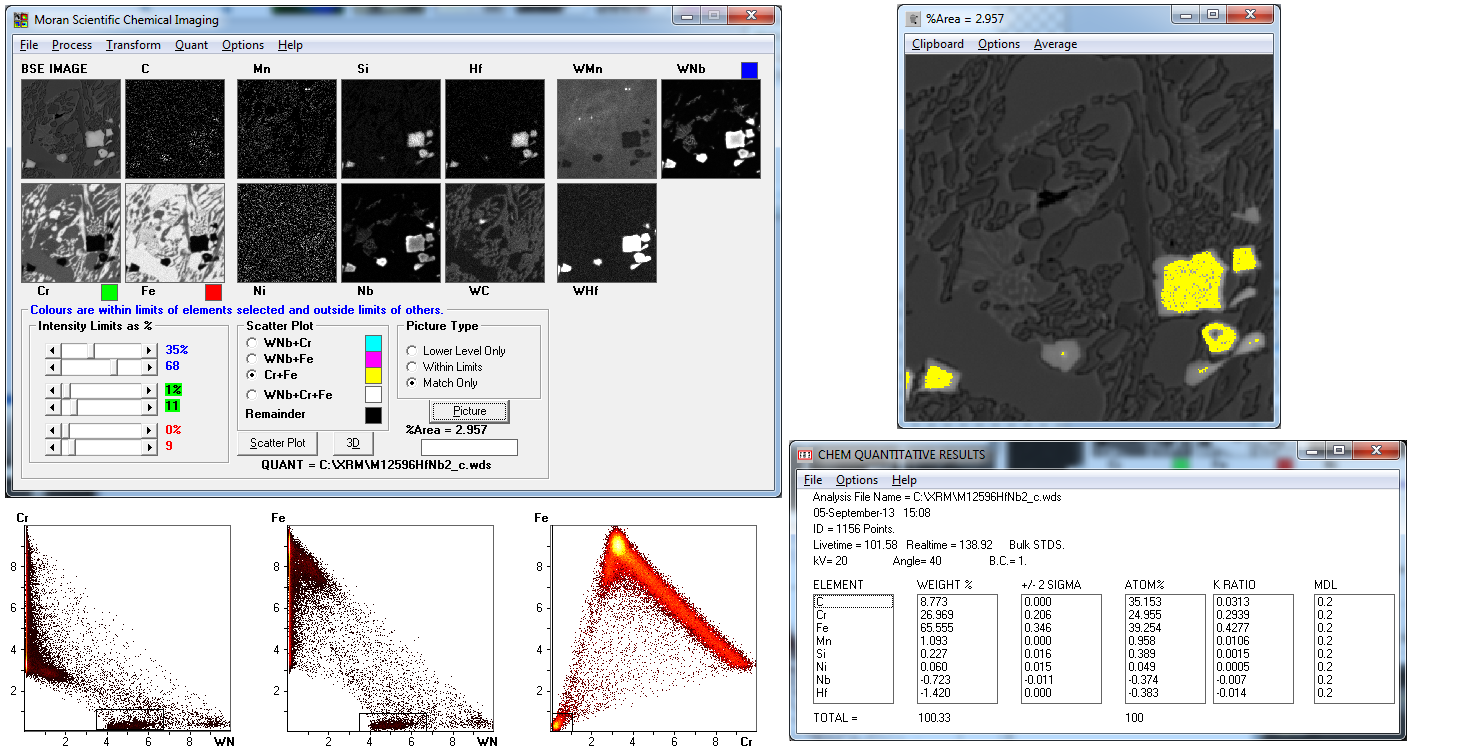
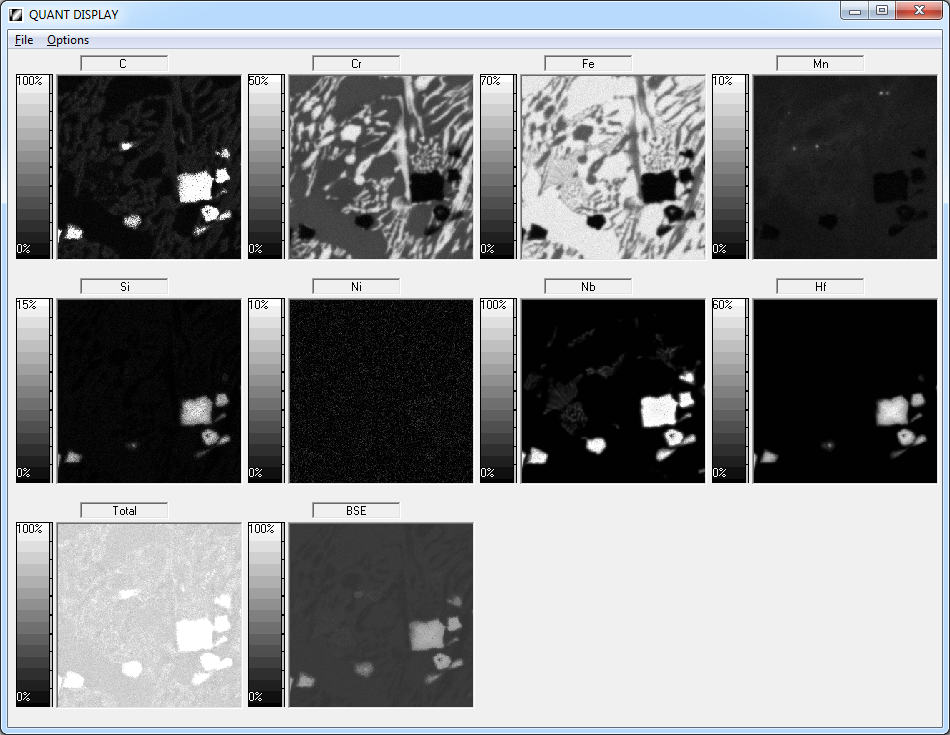
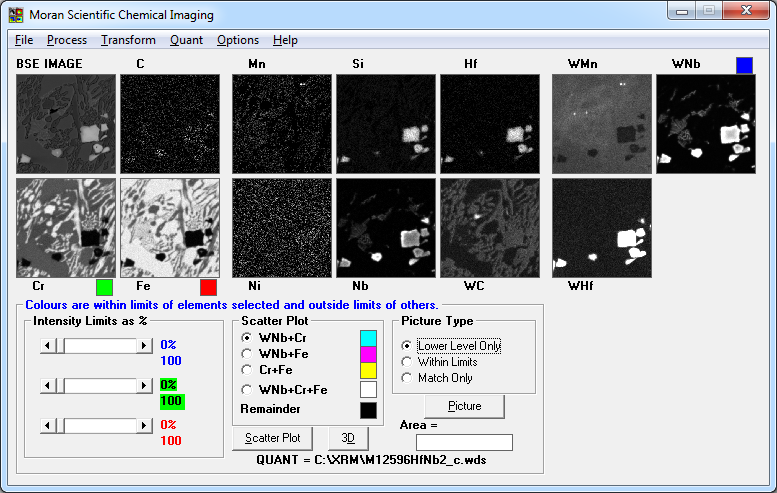
| Product Description As part of the X-Ray Mapping package we have the powerful chemical imaging software. This software allows the x-ray images to be presented as combinations of elements, thus allowing phases to be displayed superimposed over backscatter or secondary electron information. When collecting a set of X-Ray maps, there are three options: Collection of 1) The full spectrum 2) The stripped spectrum 3) The integrals at each pixel. Once an X-Ray map has been collected, it can then be processed via a variety of techniques and associated software. If a map of all the elements has been obtained from stripped spectra, this information is easily transformed into quantitative information and may be presented via a number of different processes. One such process is the display of different quantitative levels for each element, superimposed over the backscatter electron information. This is achieved by selecting a suitable elemental range and then sweeping this range to show dynamically the changes in composition as a selected colour. See the following example. You can choose different elements that occur in the specimen. For example, Ca, Mg and Si in a weld slag matrix. The relative intensities can then be plotted against each other, in either two dimensions or, more powerfully, in three dimensions. On these scatter plots there will be clusters of points corresponding to the different phases in your specimen. The thermal scale shows the intensity of clustering. The following is from a 256 x 256 Quantitative X-ray map From a scatter plot you can select a cluster of points and then redraw the image. The new image then shows where the selected analysis points appear on it with an assigned colour (e.g. Yellow) superimposed on the following backscatter image. Quantitative analysis can then be performed on the selected analysis points often to accuracy of two decimal places. This is not common in routine analysis. |
|
|
| Any Questions? Please feel free to contact Moran Scientific to discuss your requirements. |